

Random Response Fatigue Analysis
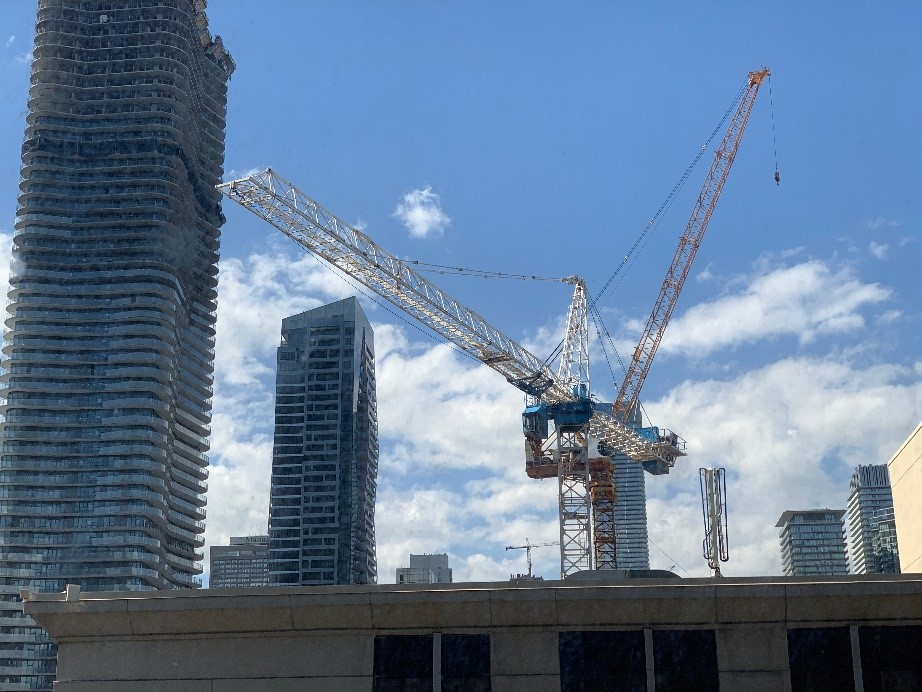
On a recent trip to Toronto, I looked out the window at a construction crane and noticed persistent motion from wind induced pressure. The motion was oscillatory in nature, rotating the arm back and forth, for as long as the breeze was present. Occasionally,
the wind strengthened, and the arm rotated further before bouncing back into a neutral position. This motion and corresponding stress continues unrecorded and unnoticed, but a lifetime of this unknown dynamic excitation could cause a disaster if the
crane is not correctly designed.
In numerous applications across a wide variety of industries, a system with unknown excitations, is common situation. It presents a significant challenge to engineers trying to meet increasingly stringent design margins. When facing a dynamically induced
fatigue failure without a complete time history of excitations, what should an engineer do?
The sophistication of engineering analysis software has increased dramatically, and engineers have more tools in their toolbox than ever before. One tool available in Altair OptiStruct calculates fatigue damage (OS-fatigue) for power spectral density (PSD) analysis. This is known as random response analysis and can be used for both parent materials and welds.
Random Response Fatigue Analysis
Random response fatigue analysis is the result of cascading analyses (modal, frequency response, and random response) that yield a statistical likelihood of a component failing due to fatigue.
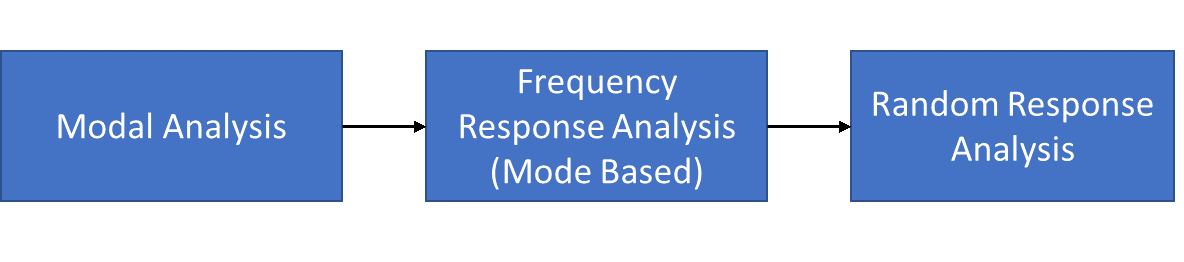
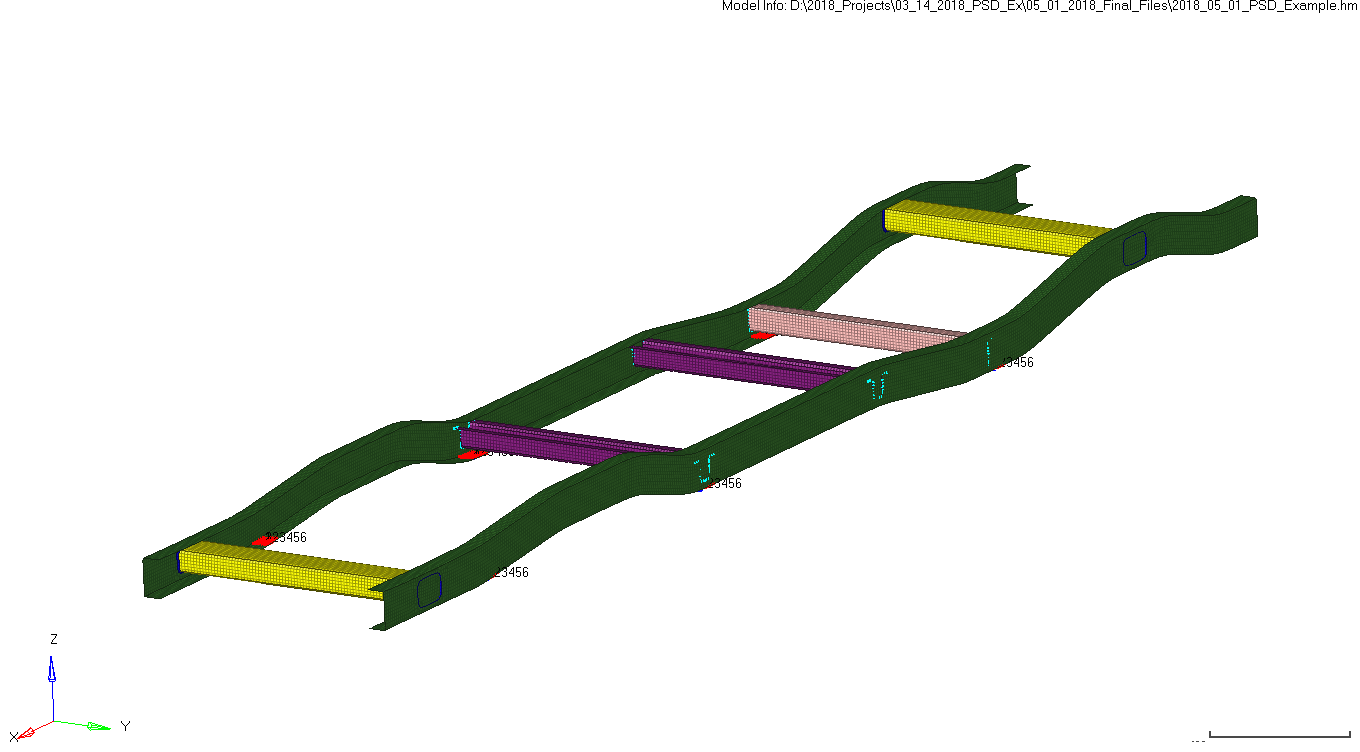
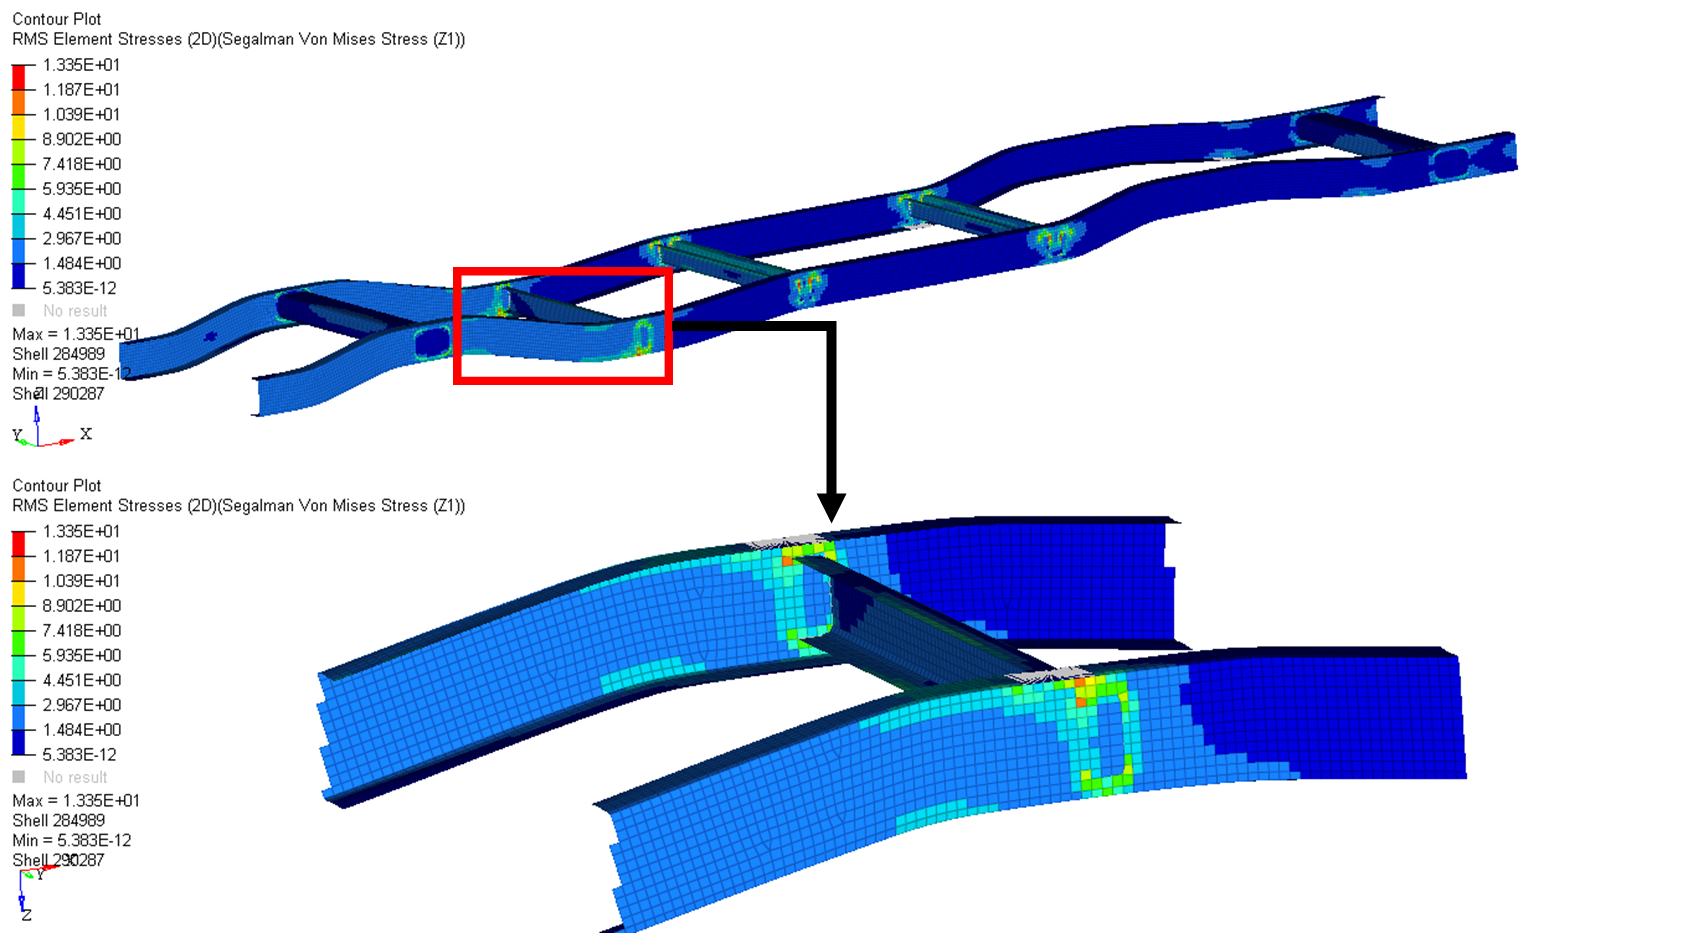
A common application of random response fatigue analysis is in the automotive industry. A vehicle chassis, such as the one shown below, needs to be able to withstand hundreds of thousands of miles of operation.
PSD Input Profile
During its lifetime a vehicle will see a multitude of excitations. From potholes to steady state harmonic excitations, (simply driving over smooth highway), every event induces a cycle of stresses. When these are added up over the lifetime of the system, they could cause fatigue failure. Many of these events are also dynamic, meaning that the cycle can occur at rates higher than 100 per second.
While some level of data collection is necessary, trying to develop an input excitation profile for a direct transient solution is impractical and unnecessary. A better approach is to collect data that will allow the characterization of the statistics in the dynamic duty cycle. This data can then be used to create an acceleration spectral density profile, or PSD input excitation profile.
Fatigue Material Properties
Random response analysis requires all the same material properties needed to run a modal analysis. In order to calculate fatigue damage values, fatigue material properties need to be added to the material definition card (MAT1). This can easily be done
even if all the fatigue properties are not known. In Altair HyperMesh, the fatigue material properties can be estimated if the ultimate tensile strength, yield strength, and material type are known.
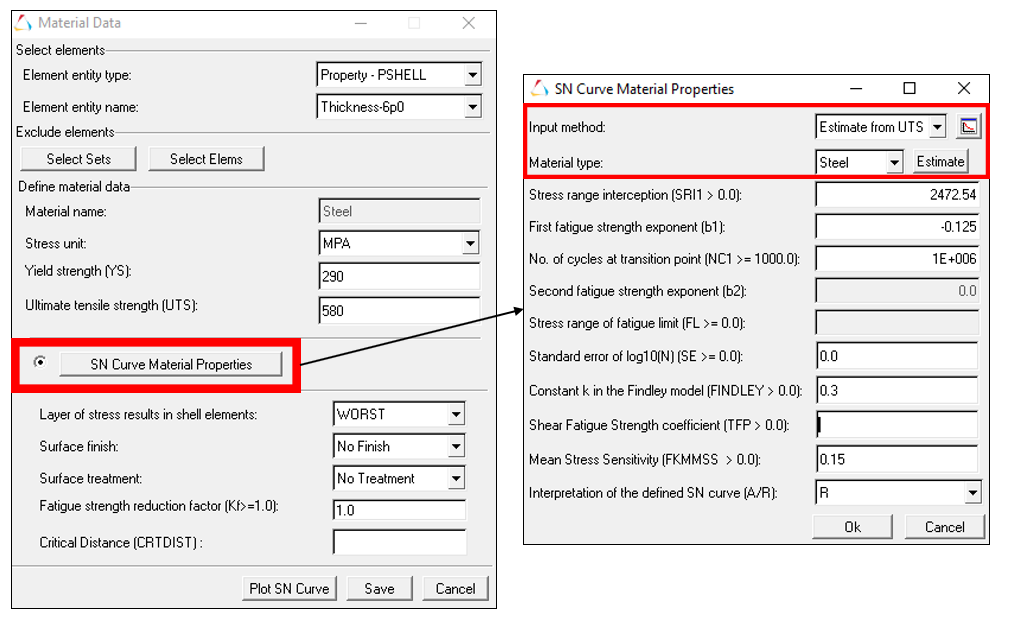
The image above shows the popup windows that can be used to either directly enter known fatigue material properties or estimate them. While it is important to ensure accurate material properties before final validation, these estimations can give accurate insight on problem areas.
Understanding Results
A PSD analysis is the PSD input excitation profile. This is the statistical likelihood of accelerations that a system will experience throughout its duty cycle. The input to a PSD is random, so the results are random. When drawing conclusions there are several responses that are useful:
- Stress
- Strain
- Fatigue damage values
- Dynamic response shapes and frequencies.
Stresses and Strains
Stresses and strains are typically shown as standard deviations of root mean squared (RMS) results. If a stress contour shows a one sigma RMS value, it means that the system will have stresses at or below the contour values for 68% of the system’s duty cycle.
Fatigue Damage Values
The most useful results when drawing conclusions from random response fatigue analysis are the damage values. This is an indication of whether the system is susceptible to fatigue failure. These numbers are based on the fatigue curve of the material, the number of stress cycles seen by the material, and the amplitude of the stress cycles.
In many fatigue analyses, counting the number of cycles is straightforward since the results are deterministic. Since random response is stochastic, a specialized method is required. There are several methods available within Altair OptiStruct, with the
most popular being the Dirlik method. Once the amplitude and number of cycles is known, damage induced on the material is determined by applying the following equation:
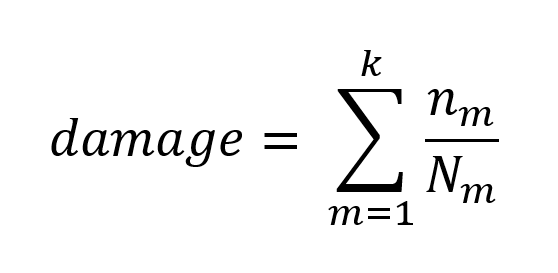
Miner's Rule
Where nm is the number of cycles that occurs at stress Sm and Nm is the number of cycles at Sm that results in failure of the material. Miner’s rule simply creates a ratio of the summation of induced
damage over damage required to achieve failure. Values below one represent a system that is not predicted to fail due to the input excitation. Values of one and above represent a system that is likely to see fatigue failure and require redesign. Once
it has been determined that an area is susceptible to fatigue failure, reviewing the stress spectrum will indicate which dynamic motion and response frequency needs to be altered.
Dynamic Response Shapes and Frequencies
Random response analysis is a dynamic analysis which means that elastic mode shapes are excited. In order to change the design to correct unfavorable results, the frequencies and shapes that induce the results must be understood. A good first step to obtain a clear picture of the response is to generate a spectral plot of stresses at a high stress location. In the stress plot above (Figure 5), the highest stresses occur near a weld. Plotting peak stress on a frequency step basis will result in the spectral plot below (Figure 6).
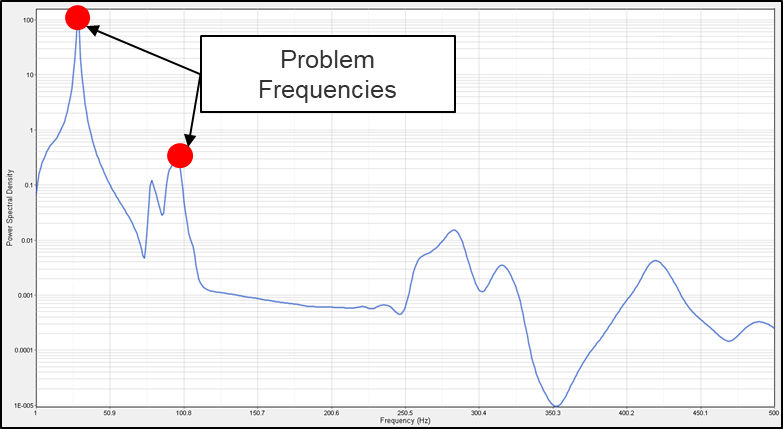
The graph above shows that two frequencies contribute the most to the RMS stress. Reviewing frequency response displacements at the problem frequencies (determined from the stress spectrum) will give the user insight on the motion that is causing stress within the component.
Conclusion
When systems are subjected to a lifetime of dynamic excitation, fatigue failures are highly likely. Using the powerful fatigue analysis tools in Altair OptiStruct, will generate valuable results and meaningful conclusions. These conclusions will prove as an intelligent guide on how to evolve to a robust design and reduce the likelihood of fatigue failure.
For more information on random response fatigue analysis, request a demo with one of our technical experts here.


