

Altair SAO: Identifying Usage Outliers
There are literally millions of software usage records collected by software asset optimization (SAO) over months or years. The primary objective of SAO is to provide a number of objective usage metrics that help with rightsizing the software inventory. When there are 100s or 1000s of software features being used on a regular basis, it can be very laborious to go through each software feature to inspect its usage metrics. Add to this the number of software features available and tracked by SAO but never used and the sheer amount data can become overwhelming. Typically, a scant third of the software features exhibit any usage at all.
Though SAO enables users to browse through each and every software feature to inspect its usage, the sheer volume of data makes this exercise very time consuming.
Altair SAO provides a very useful report that assembles the most useful metrics for all software features in the system that have some usage. This is called the summary usage report and is shown below. The date range used for this report is year-to-date (YTD). Strategic decision making requires data collection over a longer period of time. This summary report gets more meaningful when the data collection exceeds four to five months.
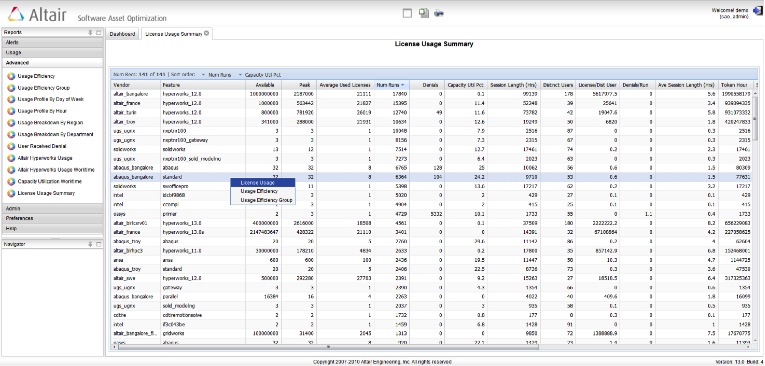
In a previous blog post, I provided a list of key metrics. The summary usage report provides these metrics in columns for every software feature that was used during the date range (YTD).
Identifying Outliers.
SAO provides this data in a tabular format and provides a multi-key sorting functionality. This makes it extremely easy to select a number of metrics and sort the table to 'bubble-up' outliers if any.

For example, one could sort this table based on Peaks, and quickly compare the value in each row to the available licenses. If the Peak is less than available, the software feature clearly has excessive inventory and would be a good candidate for reduction.
If the Peak value for a software is equal to the available licenses, one needs to check the number of denials and denials/run. If the denials/run metric is high, the software would warrant increased licenses. Generally, there should be some denials for a software feature. Too many denials would imply loss of productivity. Each company decides what its tolerance level for denials could be, and denials/run could be a good way to estimate if the level of denials is acceptable.
A very important metric available in this table is Capacity Utilization %. Sorting this table based on this metric can help identify all software features that have very low Capacity Utilization. As noted in a previous blog post, interactive software available on users' desktops may show very low capacity utilization if a company is using the software in one shift only. In many cases, inspecting the standard deviation of the peak software usage across 24 hours can indicate whether the usage is evenly spread or exhibits a 'lobe'. Typically, batch software that is executed on high-performance computing (HPC) clusters will exhibit very low deviation across 24 hours with a highly circular usage profile.
Another important metric provided in this table is the number of distinct users. This is especially useful for planning for a future expansion or reduction of the user base. One can use the Number of Licenses/Distinct User to estimate what % of users uses this specific software feature. If the Denials/Run ratio is acceptable, this number could be used to determine increase/reduction of licenses based on the expected new user base.
Drilling Down
Once the user identifies a software feature of interest, this report provides access to two different usage reports: license usage for the selected software, and a usage efficiency report. From that point, the user can access other reports without the need to set vendor/feature filters. SAO used the filter values used in the last displayed report.
The summary usage report is a very convenient way to access various license usage reports once outliers are identifies based on metrics of interest.