

Altair SAO: Rightsizing Software License Inventory – Part 3
What-If Simulator Results – Forecasting & Planning
In the previous post, I discussed What-If analysis results which showed various performance metrics predictions as a result of changing license counts, and/or setting additional constraints such as timeout values and allowing only a certain number of simultaneous sessions for a user.This post will focus on using the simulator for forecasting/planning activities. Administrators can run simulations with an increased or reduced number of users for a specific software. It is obvious that more licenses will be needed if more users are expected to use the software, and less licenses will be needed if fewer users are expected to use the software. What-If simulations enable exploring multiple scenarios and using different criteria preferred by different companies to select license counts most suitable for their unique environment.
Simple Approach
In the absence of tools designed to help the administrator to explore different strategies for forecasting and planning activities, administrators use a simple metric such as license/user, and use that factor to increase or reduce licenses. If there are 3 users sharing a license currently, administrators can simply use that factor to calculate how many licenses should be procured or dropped if there were 30 additional users expected to work in the next year. In this case, the administrator could choose to simply add 10 licenses, or 30*1/3. It does not turn out to be the best choice but it’s easy to use and it works fairly well under a few scenarios.
In reality, this approach can be acceptable for cheaper software, and with the assumption that usage patterns will stay fairly constant. For more expensive software where the cost per license could potentially run into $10K or more, getting a better estimate closer to expected performance can save a lot of money. In addition to this, administrators or managers know a little more about the expected usage patterns of new users. Some of these new users could be occasional users, and some others use the software all the time. Usage pattern distribution cannot be accommodated well using the simple arithmetic approach.
Forecasting/Planning using Objective What-If analysis
The Simulator supports the following use case for forecasting and planning for the following year:
- Predict performance metrics for varying number of licenses with timeout and maximum concurrent sessions constraints for increased/reduced users.
- Use thresholds to define User Grouping based on 2 metrics – Average Session Length, and Total Usage - that will create 3 usage groups for LOW, MEDIUM, and HIGH users. The simulator will also export these user group lists
- Use profile distribution of increased/reduced users from LOW, MEDIUM and HIGH usage groups
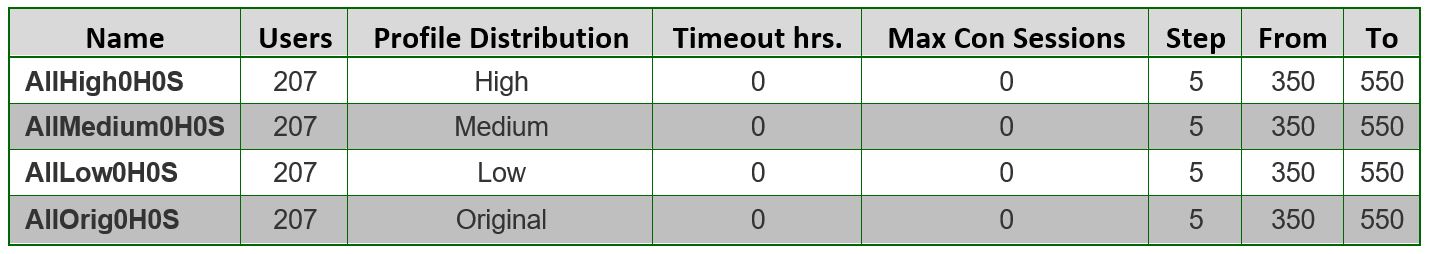
The simulator allows for setting up of multiple What-If simulations like shown below. Timeout and Max Concurrent Sessions constraints can be specified. The value 0 implies no constraint. The license count sweep for any simulation starts with the From value using a step size specified in the Step value. In case of Forecasting Analysis, the user specifies the number of additional users expected to join the team in the following year. A negative number will indicate a reduced number of users. The profile distribution indicates the distribution of these users divided into Low/Medium/High categories. The example below shows 4 different What-If analysis for 207 additional users, with 4 different profile distributions. Original profile distribution indicates these 207 new users will have the same usage patterns as exist today before the users are added.
Performance Metrics from 4 Forecasting Analysis compared with the Baseline data set from What-If analysis are shown below. No timeout or Maximum Concurrent Sessions constraints were set. In all charts, the lowest line reflects performance metrics for the current user set.
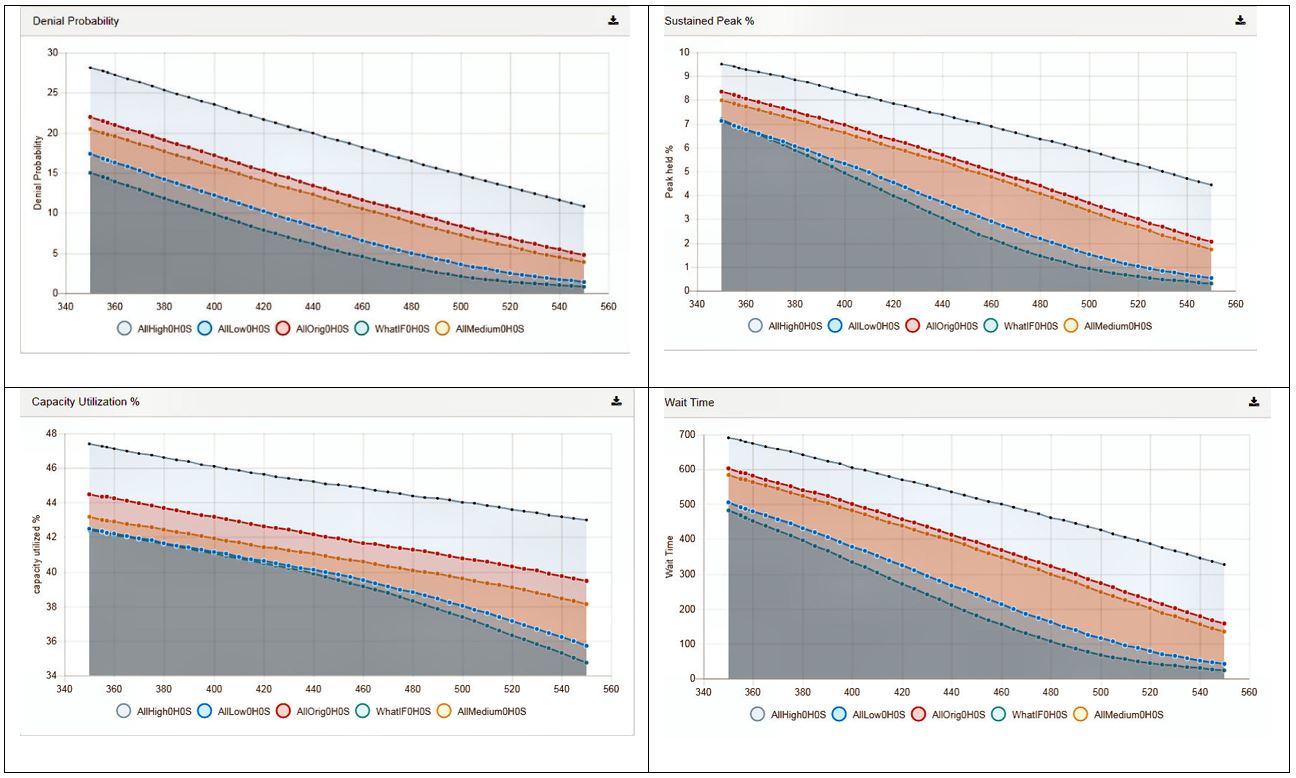
Selecting the most appropriate License Count
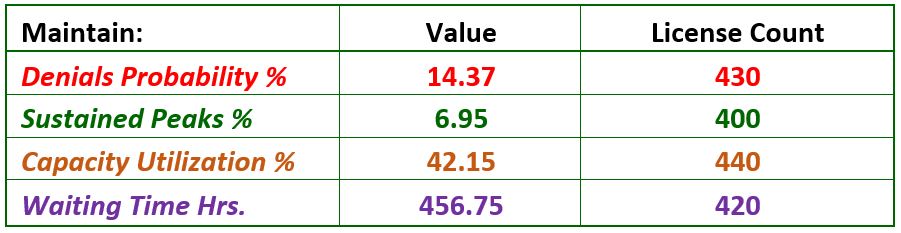
Let us look at the 4 performance metrics for the existing license count and existing number of users. There are 357 licenses used by 993 users at this time. The performance metrics are:

If the administrator is satisfied with these performance metrics, the table above is a good place to start. There are 4 different performance metrics values that could be set as targets after adding 207 users to the current set. One can choose any of these metrics, and look up the closest value in the curve and select the corresponding license count.
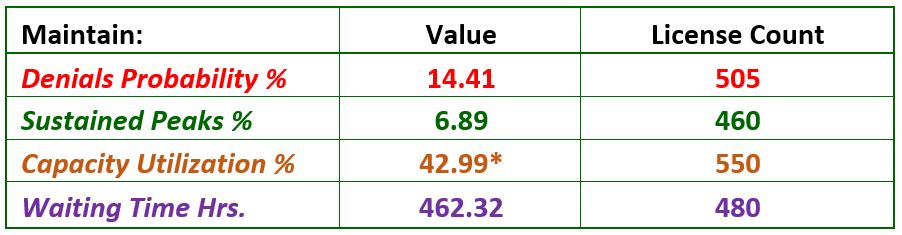
There were 4 different profile distributions used for the additional 207 users. Let us start with All Original distribution. This implies that the new 207 users have the same usage pattern as the current user group. Now for this set, inspect the 4 metrics from the AllOrig0H0S simulation, and look up the corresponding license counts. We get:
If we compare this to the simple approach which suggests we should add 74 licenses to the current count of 357 for a total of 431, we see a significant variation of prescribed license counts based on different performance metrics. Administrators can choose the appropriate license count accounting for the situation in their company.
The simulator provides further insights into selecting license counts based on the type of users expected to join the team. If for example, this is modeling software, and of the 207 users, 180 are designers, all those users will fall in the HIGH usage category, and the rest in the low usage category. The administrator can set up an appropriate profile distribution and run the simulation.
The following table shows the prescribed license counts if all of the 207 users were categorized as HIGH users. Look up corresponding license counts in the AllHigh0H0S simulation output.
Note that Capacity Utilization % goal can be met easily for much lower license counts in case when all new users belong to the High users category. It is reasonable to expect high capacity utilization for HIGH usage users. Capacity Utilization is perhaps not the most intuitive or telling metric useful to set as a target.
It is not possible to estimate license counts for added users with different profile distributions using a simplistic approach. Note in the case above, adding 74 licenses for 207 users belonging to ALL HIGH usage group will provide extremely poor performance for the following year.
Extending Use Cases
The Simulator will need to support increasing/reducing users based on their Time Zones, if such information is collected and available from Software Usage Reporting/Analytics systems. Users from different time zones tend to balance out software usage and affect peak usage.
I will provide some insights into the Altair SAO What-If Simulator software in the next post.