

Digital Debunking: Has the Motivational Iceberg Poster Been Lying to Us?
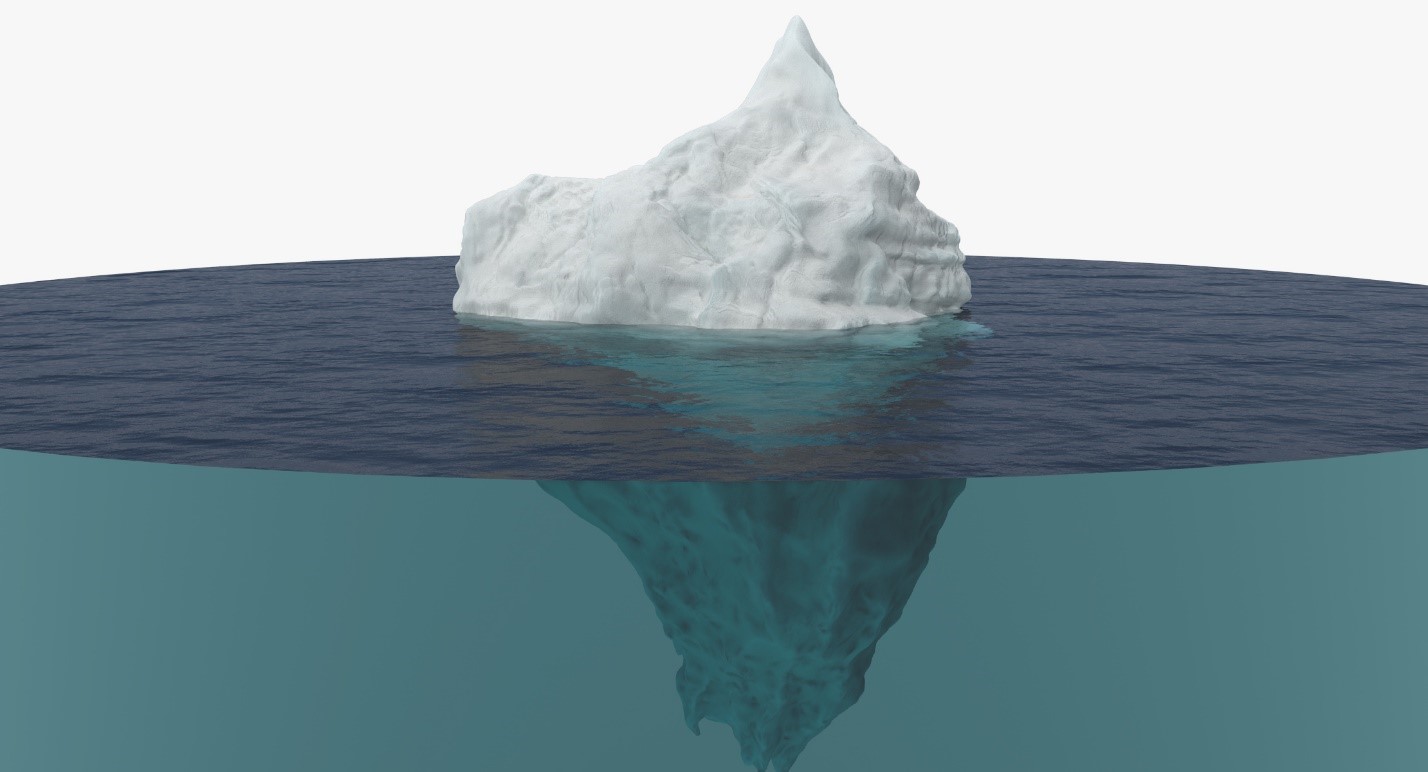
Only about 10 percent of an iceberg is typically visible above the water. This fun fact has been coopted widely as a visual analogy of the observable and unseen elements of the human experience, especially by makers of cheesy motivational posters. You’ve likely seen some iteration of the image below, demonstrating the elements below the surface that influence the success others see.
For most people, this well-worn trope probably barely registers, but scientists and engineers might have a nagging feeling that there’s something wrong with this picture. Do the physics support the floating iceberg image we’ve seen a thousand times, or has this motivational poster been lying to us this whole time?

The “tip of the iceberg” metaphor, generally, is supported by science. Ice has nine-tenths of saltwater’s density, and due to these similar densities, it is true that about 90 percent of an iceberg floats below the water’s surface. The problem, however, is the orientation of the iceberg as it floats.
An asymmetrical object with a fairly uniform density like the classic ice cream cone-shaped iceberg would likely not come to rest in a vertical orientation. Similar to how a pool noodle floats horizontally, not straight up and down, it stands to reason that the iceberg would come to rest in a manner that distributed its mass most evenly, likely in a horizontal orientation.
Without an iceberg-shaped pool toy readily at hand, the next best option is to test this hypothesis using computational fluid dynamics (CFD) software. Armed with a three-dimensional virtual iceberg model and Altair CFDTM, we set out to determine at which orientation this iceberg would come to rest in the water.
The smooth particle hydrodynamics (SPH) solver was chosen for this exercise. Altair CFD also includes a general-purpose Navier-Stokes and a Lattice Boltzmann Method (LBM) solver, but to simulate the iceberg’s detailed geometry as it interacts with the water, SPH is superior to these mesh-based methods. SPH is a particle-based numerical method that is especially adept at modeling flows influenced by heavy deformations as well as moving boundaries and free surface flows. Practical applications of SPH include oil flow in gearboxes, nozzle simulations, mixing, and water management like wading and sloshing.
SPH also scales well on graphical processing units (GPUs), making simulation of complex geometry flow prediction much faster than CPU-based finite volume codes. The faster processing time of GPU-based SPH analysis was especially useful considering the scale of the model being simulated.
The iceberg is realistic in size - the shape fits into a prism roughly 447 m long, 382 m wide and 646 m tall, and weighs in at an astounding 29 million metric tons. For reference, the great Pyramid of Giza is estimated to weigh six million metric tons, making the mass of this iceberg over 4 times greater than this wonder of the world. The assumed density of the sea water is 1027 kg/m3 (Arctic water) and the density of the sea ice is taken to be 900 kg/m3. This results in an iceberg occupying 32.3 million cubic meters of volume. In other words, if this thing is to move, it would make a big splash.
Iceberg model by Constantin Os
Case Setup
We took the geometry resembling what is commonly portrayed as a “caricature iceberg” shape – the shape generally looking like two cones connected by their common base (see Figure 1).
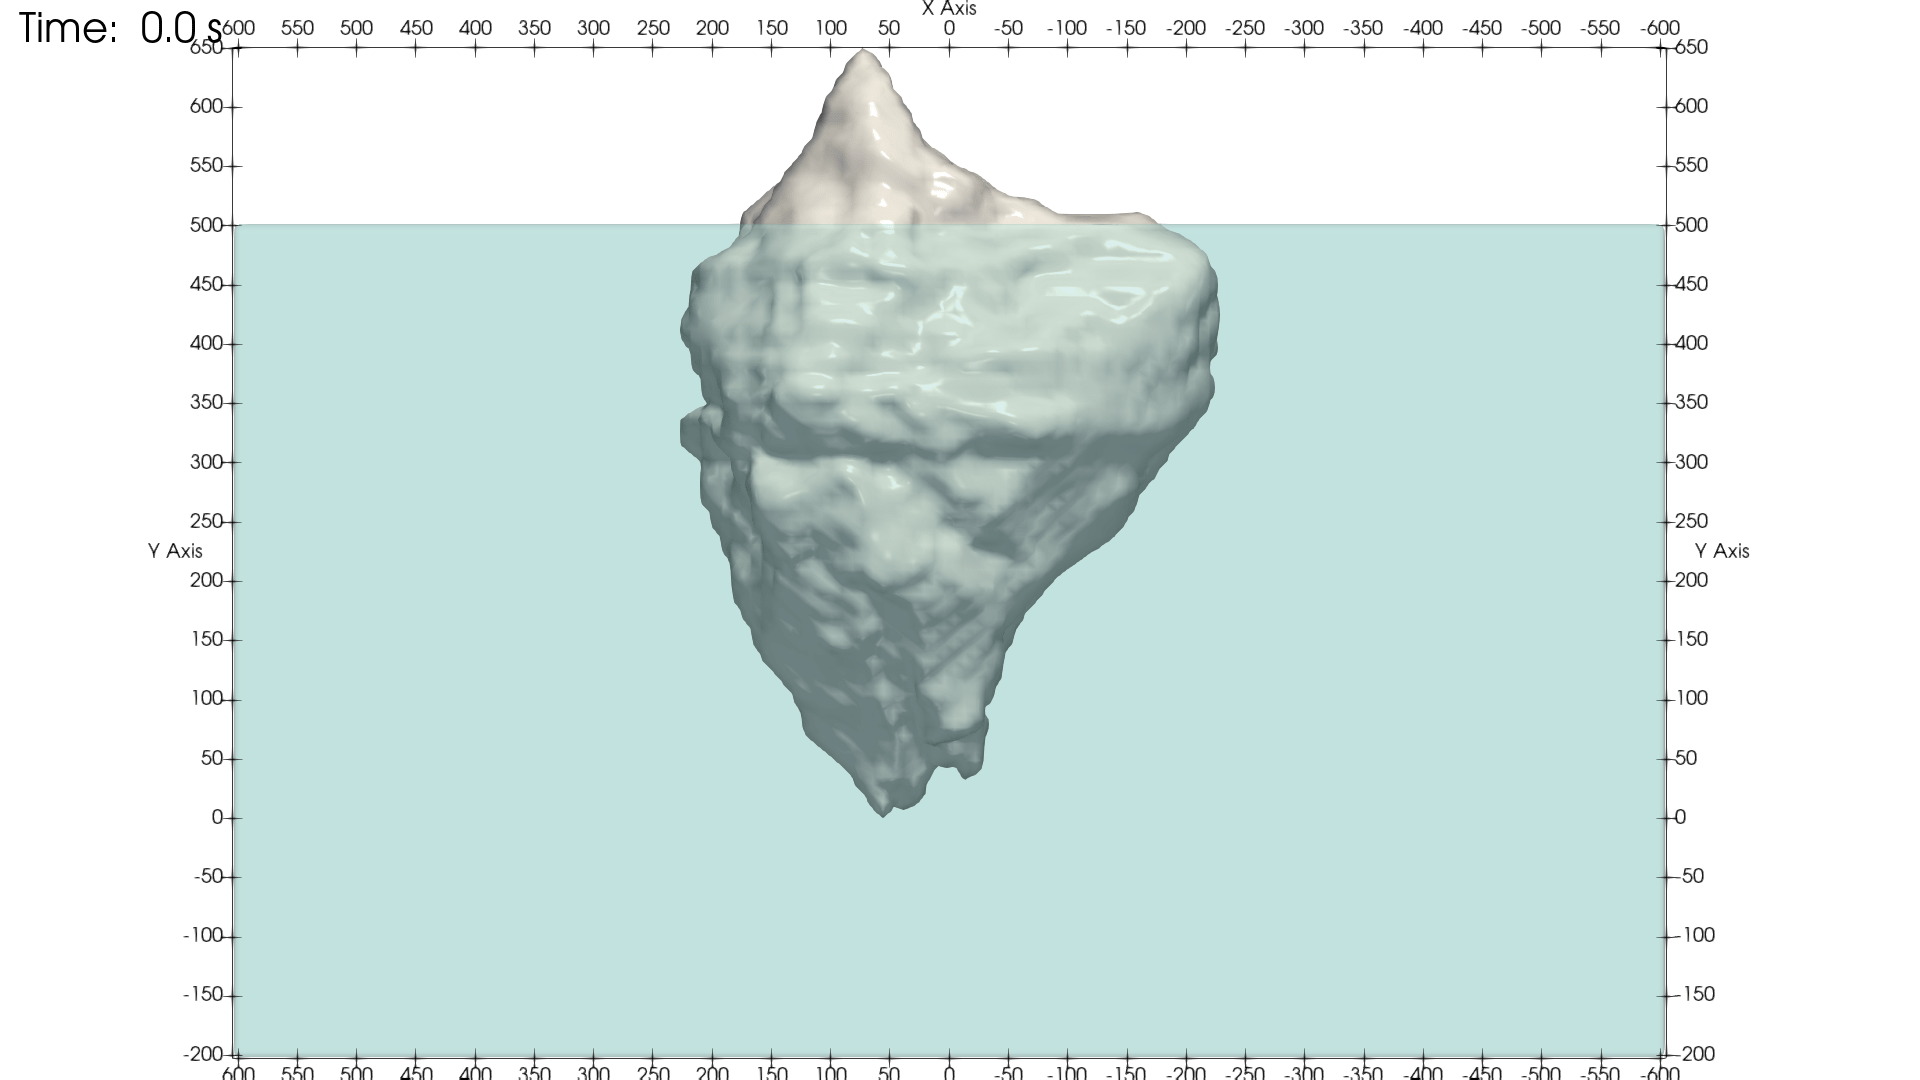
Figure 1: Initial position of the iceberg. Axes show X and Y coordinates in units of meters. Note that the gravity is acting in the negative Y direction in this geometry.
The iceberg was arbitrarily positioned in a pool measuring 1200x1200x700 m with periodic boundary conditions. The initial position is purposefully reflecting the commonly presented one. No initial forces or velocities were assigned, so initially everything is completely static.
The particle resolution used was 3 m, resulting in about 36.3 million particles. This may seem coarse but remember that the scope of the exercise is to assess the stability of the iceberg, not focus on small scale flow structures.
The entire pre-processing setup was performed in Altair SimLabTM, which allowed for trivial definitions of critical physical properties such as mass calculation, location of the center of mass, and moments of inertia. The overall pre-processing effort took around 30 minutes.
Simulation was then executed using the Altair CFD’s SPH solver. This particular simulation was a rare case requiring double precision, since scale differences in various physical properties were too much to handle for single precision.
Given the geometric scale of the problem, it was expected that several minutes of physical time would be required for the iceberg to settle, so we opted for simulating 5 minutes of physical time. This took total of 36 hours to simulate on a single GPU node.
Results
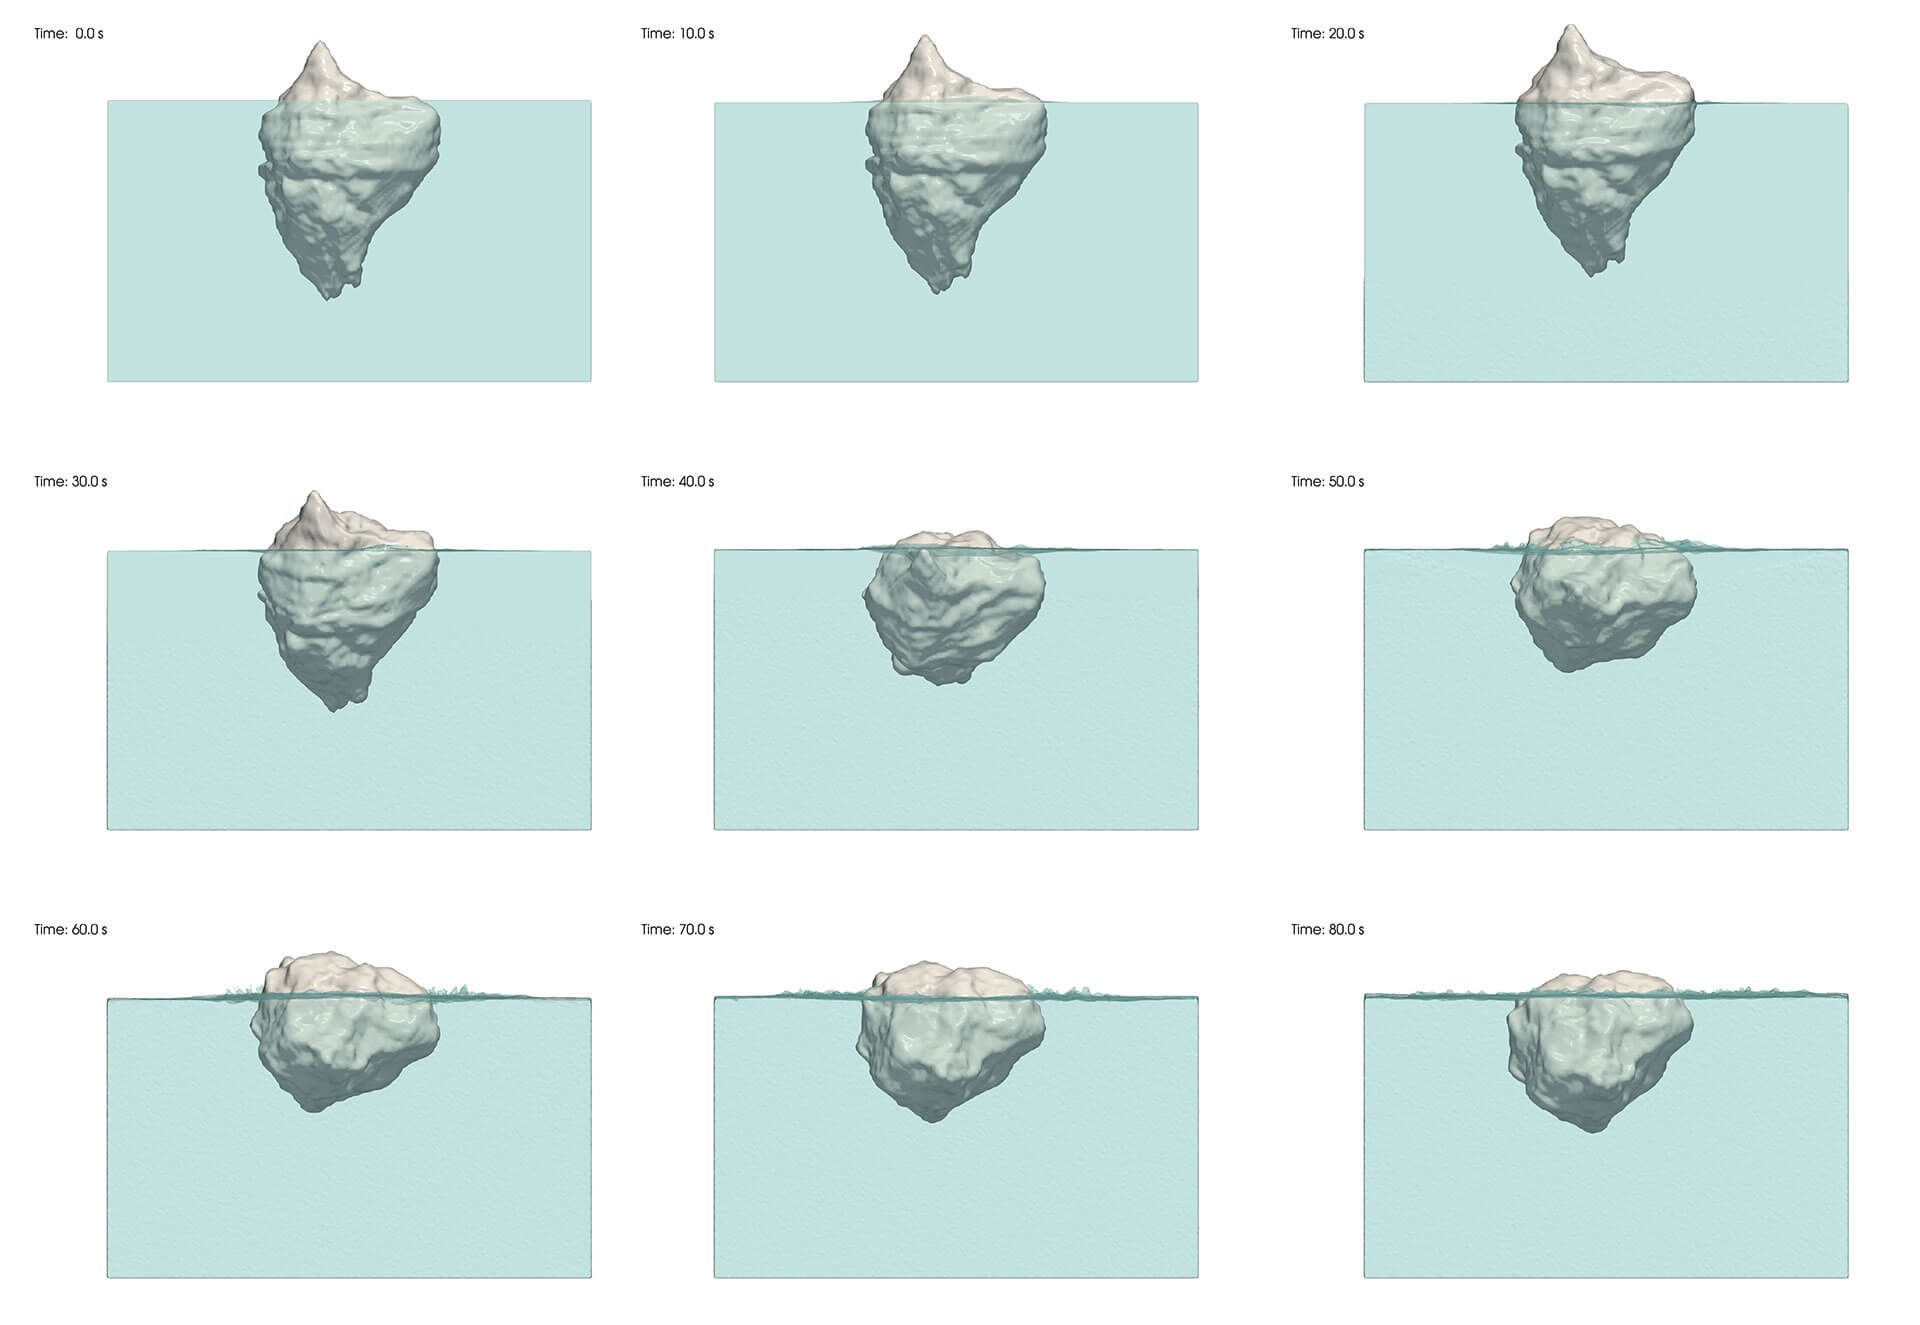
As expected, the iceberg was found to be in an initially unstable position. The iceberg starts rising and flips to the side. Stable state/position of the iceberg is not immediately found as the iceberg continues to settle throughout the simulation (5 minutes of physical time). However, it can be said that major dynamics happen in the first 2 minutes. This is also illustrated by the plot of the Y coordinate of the iceberg’s center of mass (CoM). The initial CoM location is at 333 m and it begins to stabilize around 393 m. The set of images shown in Figure 3 shows the most dynamic sequence of the stabilization process, in the first 80 s of physical time.
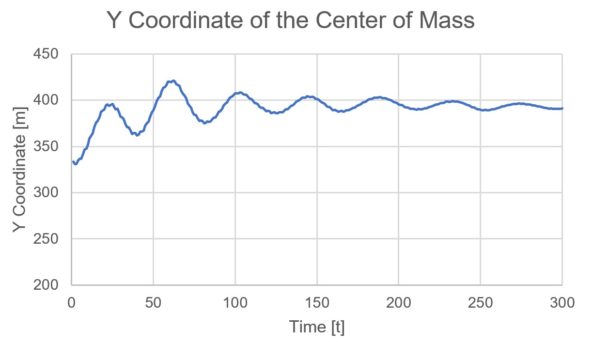
Figure 2: Y coordinate of the iceberg’s center of mass. Initial position is 333 m and approximate settling point is around 393 m.
The full animation of the 5-minute simulation can be seen below. For sake of hard-drive space, the output was limited to form a 25 frames-per-second video. This implies that in the video, 5 minutes of physical time is compressed into 12 seconds. Also, time annotation is added to the corner for ease of time tracking. This is just a note to make the visualization clear in case anyone notices that the iceberg is moving awfully fast for such a massive geometry.
Secondary analysis of the results shows that the moving of such a vast iceberg would likely cause waves in excess of 10 m (33 ft.) in height. Fine splashing (sprays) and exact wave height are probably under-resolved due to limited resolution, but the order of magnitude ought to be indicative that such large-scale splashing is to be expected.
More interestingly, looking at the velocity field shows that while the iceberg is settling, a massive high-speed current is developed under it. This current propagates at about 5 m/s from the iceberg to the bottom of the ocean, dispersing as it hits the ocean floor. The current takes a shape very similar to a reverse mushroom cloud. The fully developed structure, frozen at 250 s, can be seen in the video below.
The massive iceberg ultimately settles in a much different orientation than is typically shown on motivational posters, debunking the common image and confirming our initial hypothesis. And while this dramatic reorientation of a floating iceberg is strictly hypothetical, it may be illustrative of the potential fluid dynamics resulting from a huge iceberg that breaks off of the Arctic or Antarctic shelf.
So, if an accurate motivational poster had been tacked up in the Titanic’s wheelhouse, could tragedy have been averted? We’ll never know. But with fluid dynamics simulation software, product engineers and analysts can more precisely predict fluid flow around complex geometries, taking much of the guesswork and expense of physical prototypes out of the equation for high-value products like drivetrain components in automotive, aerospace, and heavy industry powertrain systems.
To learn more, visit https://www.altair.com/altair-cfd-capabilities/
For additional solutions on predicting hydrodynamics loads and analysis of floating structures, check out MAESTRO by MAESTRO Marine, available through the Altair Partner Alliance. MAESTRO is a design, analysis, evaluation, and optimization tool specifically tailored for floating structures.


